Stock Portfolio Analysis Pipeline
Automated ETL + risk engine mapping the efficient frontier via a native C Monte Carlo kernel and an analytic SciPy optimizer.
View on GitHubCase Study
How it was built
Problem
Modern Portfolio Theory is taught with closed-form min-variance solutions and a few neat illustrations, but real construction needs an honest view of the risk-return cloud — including all the suboptimal allocations a manager could land on if they wing it. Without that, a single 'optimal' portfolio looks correct in isolation but tells you nothing about how sensitive it is.
Approach
Built an end-to-end pipeline: pull two years of daily prices for 8 financial stocks from Yahoo Finance into a normalized SQLite schema, compute annualized returns and the covariance matrix in pandas, then run 5,000 Monte Carlo allocations in risk-return space to map the empirical frontier. Solved the analytical min-variance and max-Sharpe portfolios in closed form for comparison.
Try it live
Key Decision
Stored prices and returns as separate tables instead of recomputing returns on every analysis run. The recompute path was cheap for 8 tickers but would have become the bottleneck the moment the universe grew. Normalizing the schema upfront kept the analytical layer SQL-native and made it trivial to swap in new tickers without touching the optimizer code.
Result
Full efficient frontier mapped across 5,000 portfolios and the Sharpe-optimal allocation identified analytically. The interactive widget on this page runs the same MPT math live in your browser — drag the risk-free rate slider and the max-Sharpe portfolio rebalances in real time.
Results
Key metrics
5,000
Monte Carlo Simulations
1.56
Analytic Max-Sharpe
8
Financial Stocks Tracked
C Kernel
Native Monte Carlo Engine
Approach
Technical overview
ETL & Benchmark Ingestion
Historical price data for 8 financial stocks and the SPY benchmark is pulled from Yahoo Finance into a normalized SQLite database, with retry/backoff, price validation, and incremental fetch so re-runs only pull new dates. The schema separates prices, returns, and portfolio holdings so analytics never touch the network path.
Native C Monte Carlo Kernel
The efficient frontier's 5,000-portfolio simulation runs through a C kernel (xoshiro256+ RNG) called via a zero-copy ctypes bridge, with a vectorized NumPy implementation as an automatic fallback when the native library isn't built. A parity test holds both paths to the same result within 1e-12.
Analytic Optimization
Alongside the Monte Carlo cloud, a SciPy SLSQP solver finds the exact long-only max-Sharpe and min-volatility portfolios rather than settling for the best random draw — it consistently beats the 5,000-portfolio simulation's best Sharpe ratio (1.56 analytic vs. 1.50 from the simulated cloud).
Quantitative Risk Engine
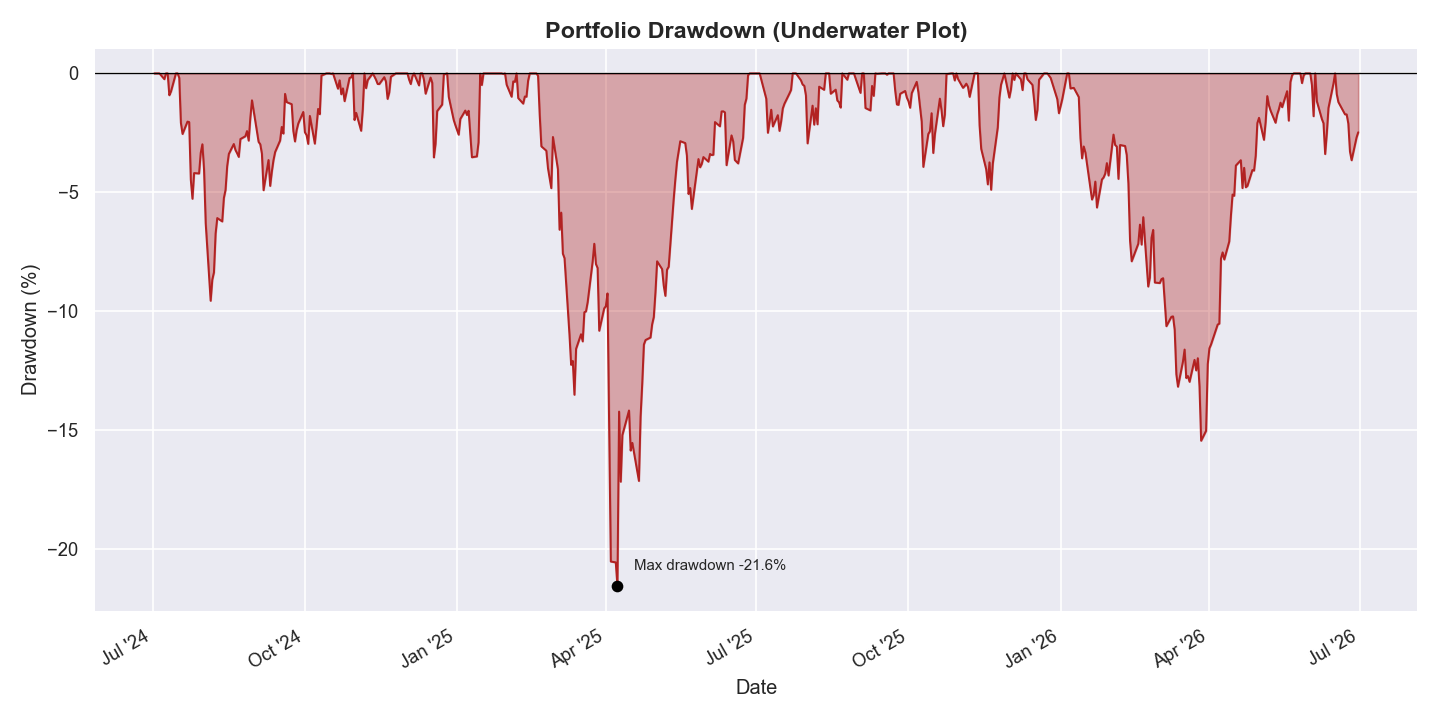
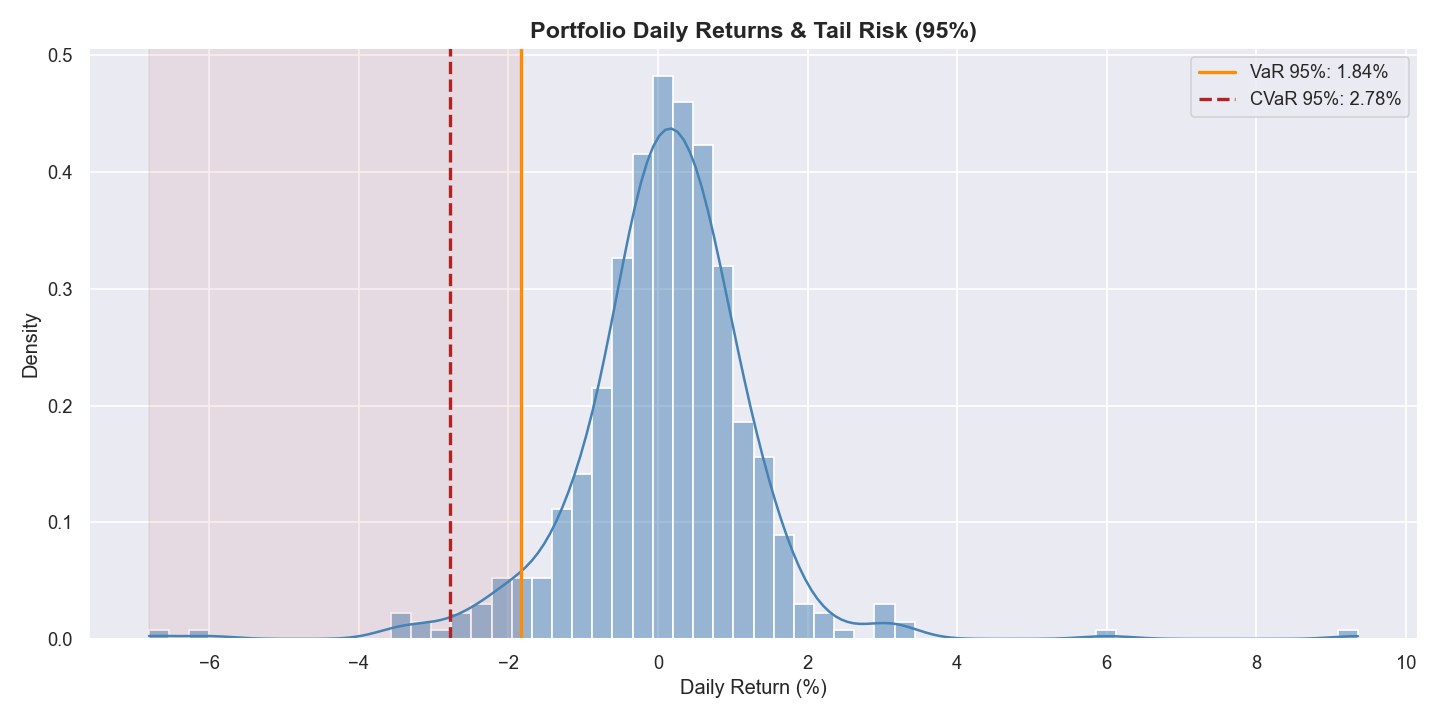
A dedicated risk module computes historical and parametric VaR, CVaR/expected shortfall, max drawdown, Sortino ratio, and beta/alpha against SPY — each metric independently tested against known values, not just eyeballed against a chart.
Gallery
Output & visualizations
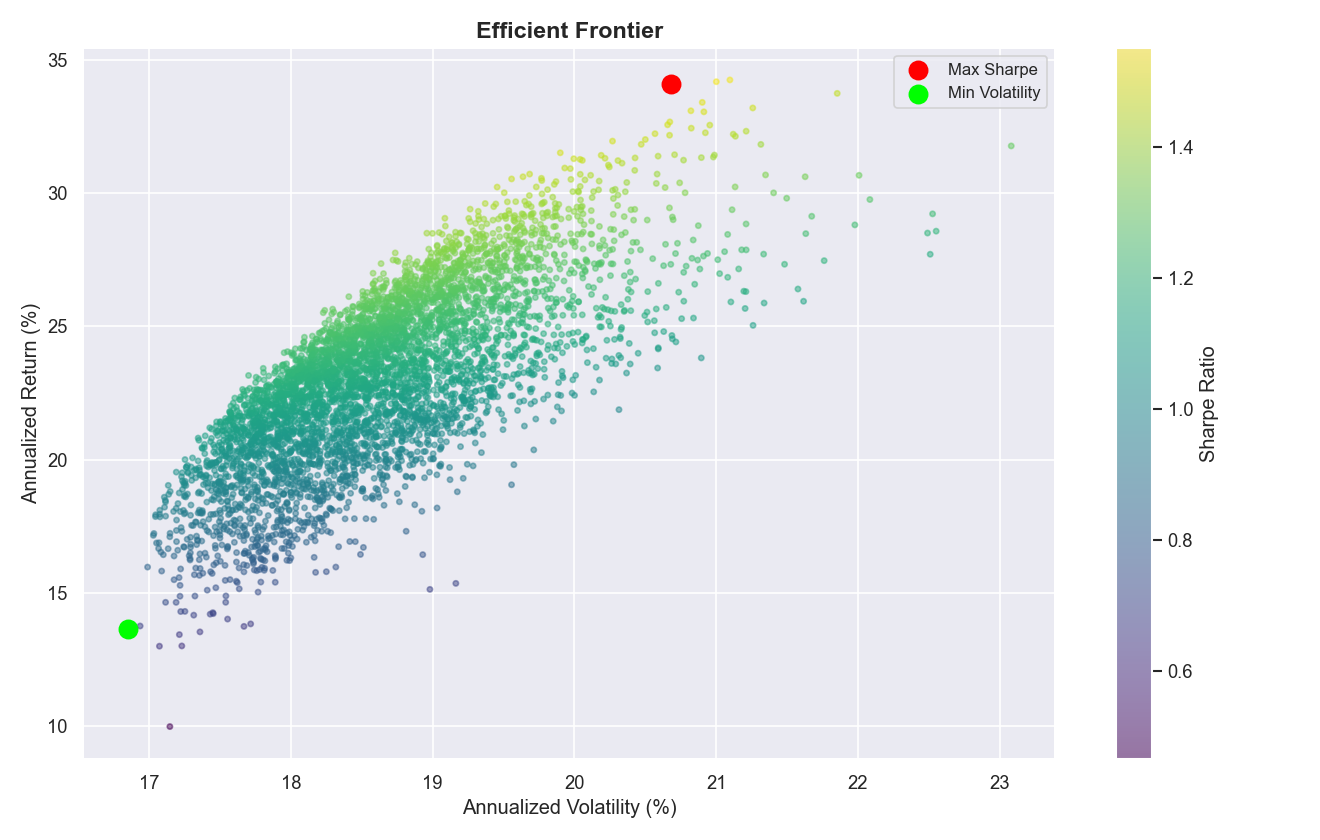
Efficient Frontier — 5,000 simulated portfolios with Sharpe-optimal highlighted
Drawdown (Underwater Plot) — Portfolio's percentage decline from its running peak
VaR / CVaR Tail Risk — Return distribution with historical VaR and expected shortfall marked
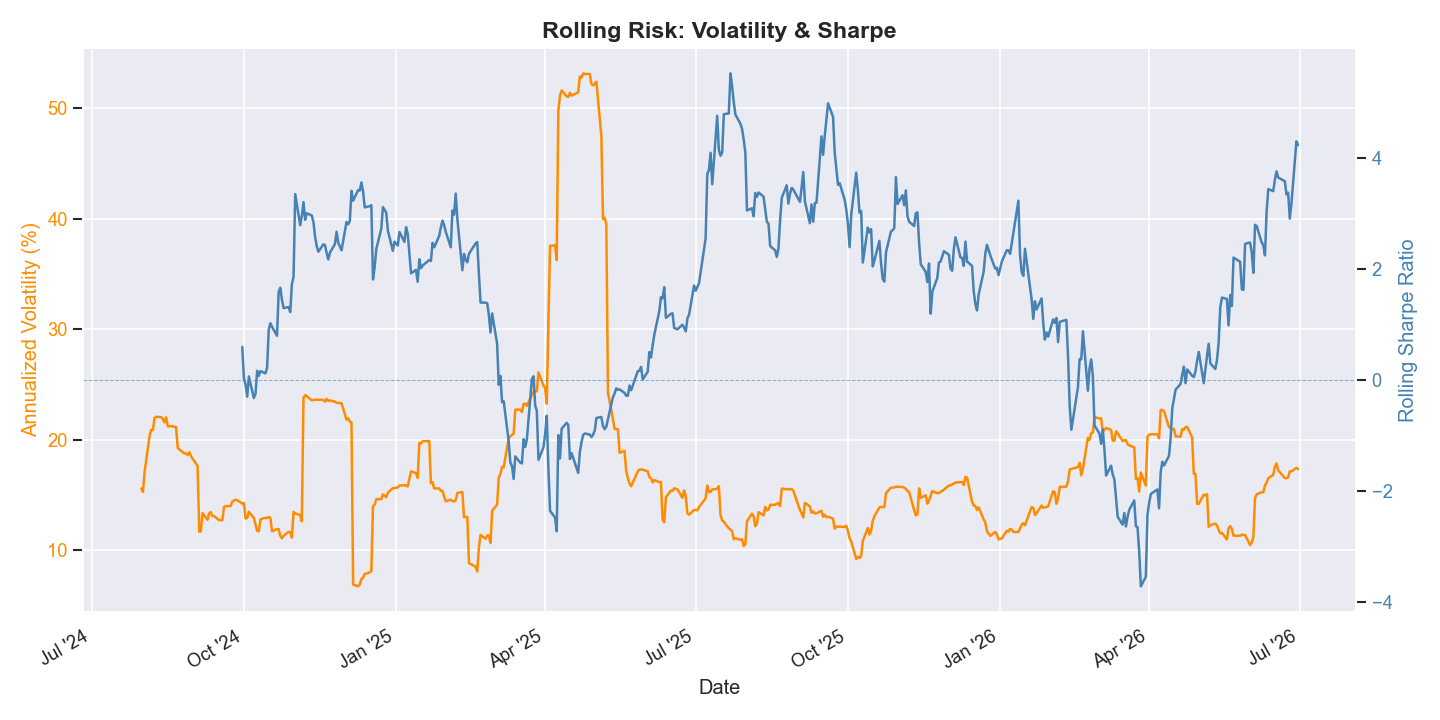
Rolling Risk — 21-day rolling volatility and 63-day rolling Sharpe, twin-axis
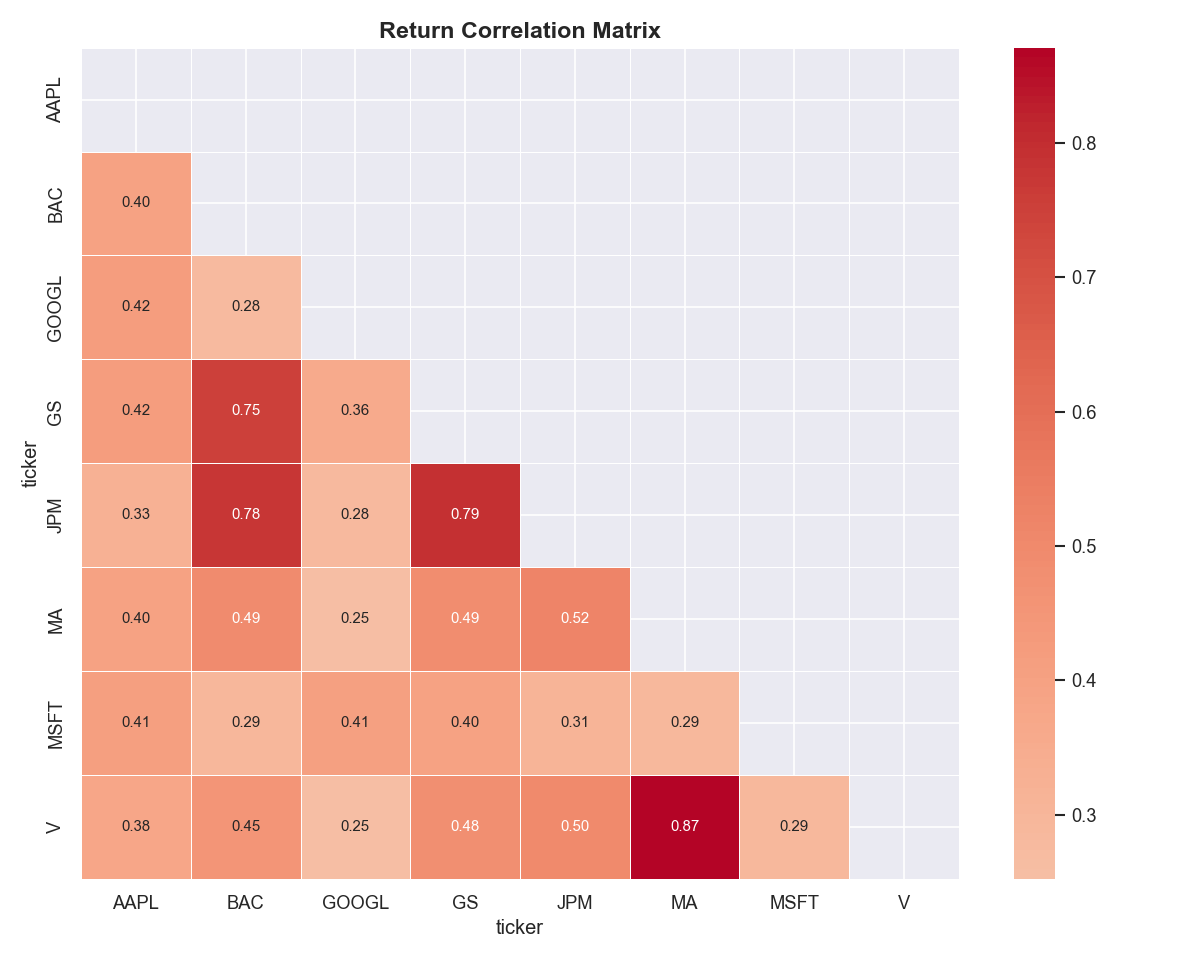
Correlation Heatmap — Asset return correlations across the 8-stock universe
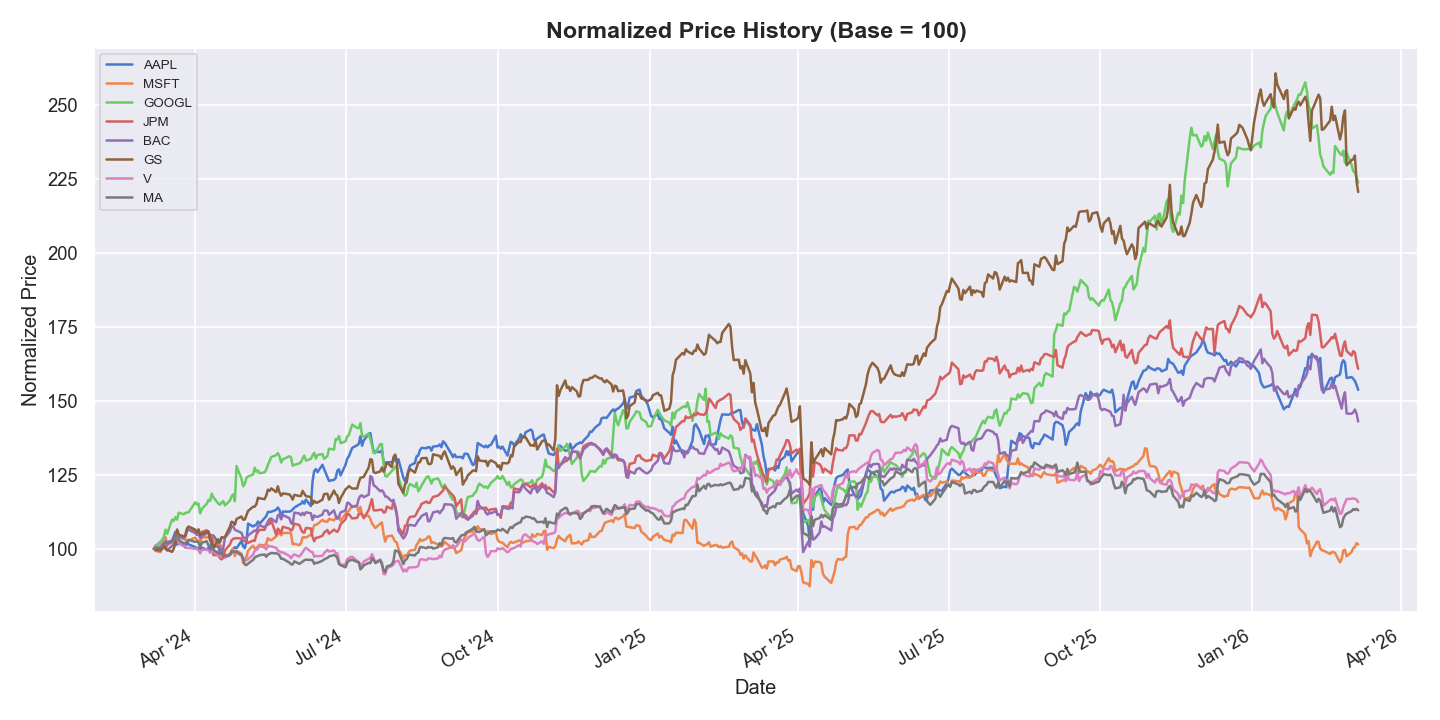
Normalized Price History — All 8 stocks normalized to base 100 over 2 years
Stack