Personal Finance Analytics
Normalized SQLite database with 10 analytical modules covering budget variance, cash flow, and anomaly detection.
View on GitHubResults
Key metrics
12 mo
Synthetic Data Generated
7
Database Tables (3NF)
10
Analytical Dimensions
10
US States Modeled
Approach
Technical overview
Schema Design
The database was designed in Third Normal Form (3NF) to eliminate redundancy and ensure data integrity. Seven tables separate concerns cleanly — transactions, accounts, categories, budgets, tax parameters, cost-of-living indices, and monthly summaries — enabling complex joins without data anomalies.
Synthetic Data Generation
Twelve months of realistic banking transactions were generated using Faker with domain-specific rules — realistic merchant names, seasonal spending patterns, and category distributions consistent with actual household finance behavior. This approach produced analytically meaningful data without requiring real financial records.
Analytical Modules
Ten SQL-driven analytical modules were implemented: budget variance tracking, rolling cash flow projections, anomaly detection (transactions outside 2σ of category norms), savings rate analysis, and discretionary vs. fixed expense ratios — a suite that mirrors reporting found in personal finance platforms.
State-Specific Modeling
Tax brackets and cost-of-living indices were parameterized for 10 US states, allowing the system to compute after-tax income and normalize spending patterns geographically. This demonstrates an understanding of how macroeconomic context affects individual financial analysis.
Gallery
Output & visualizations
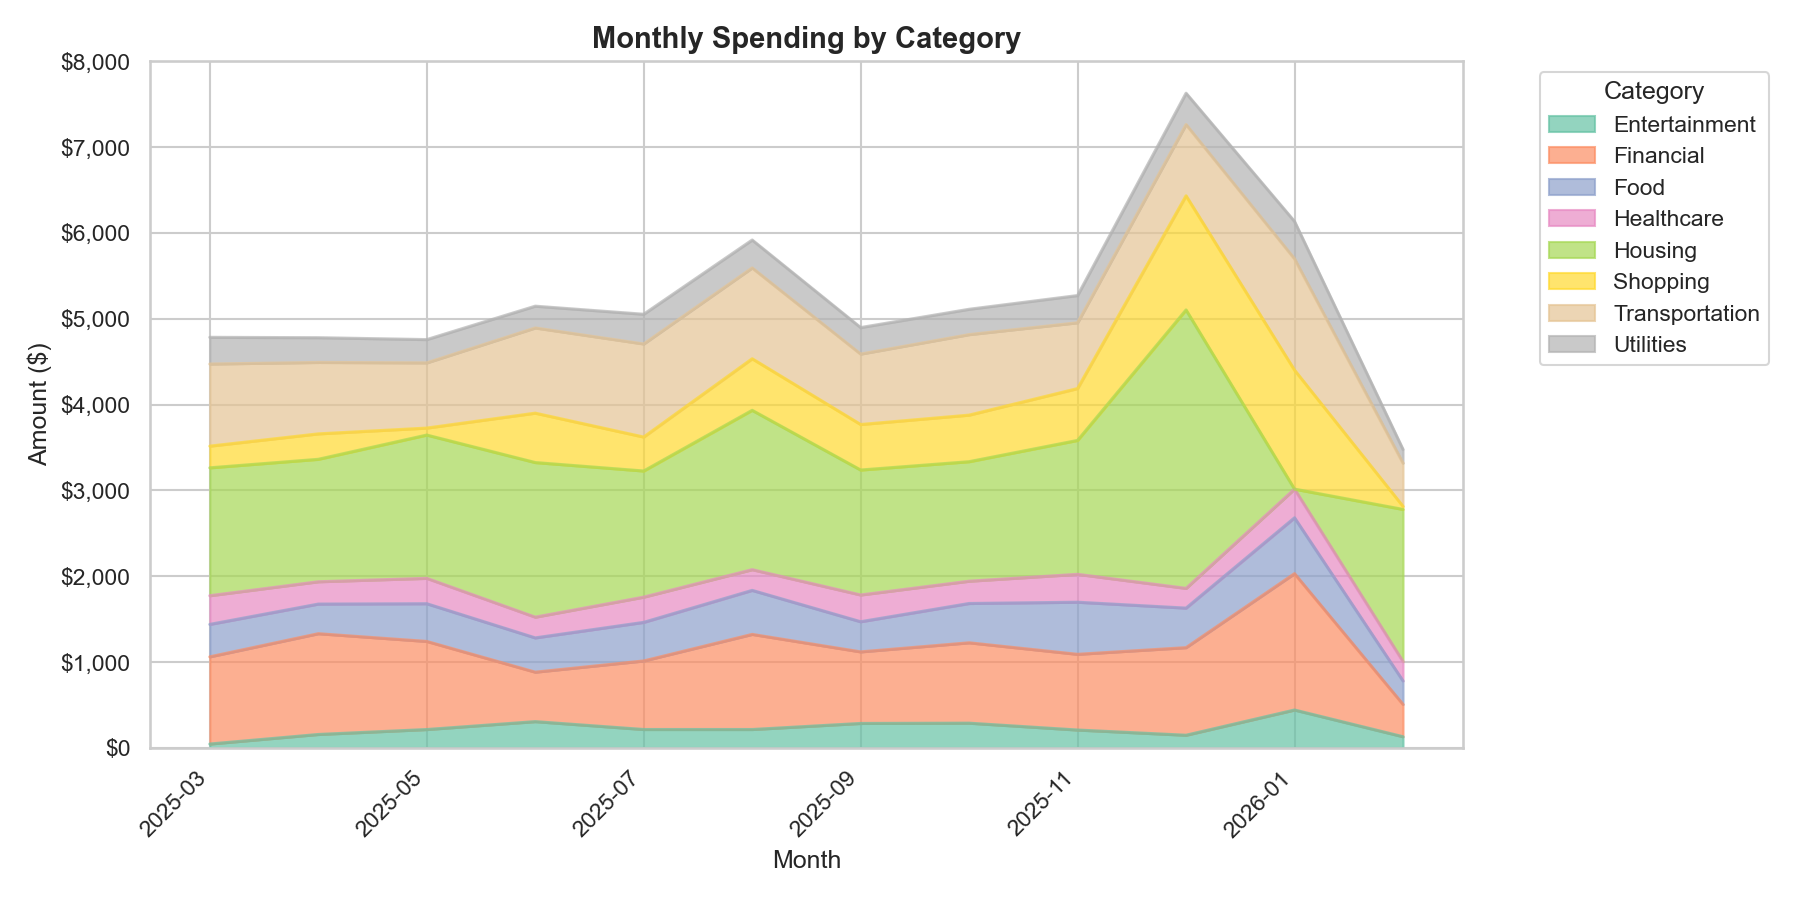
Spending Trends — Monthly spending over time by category
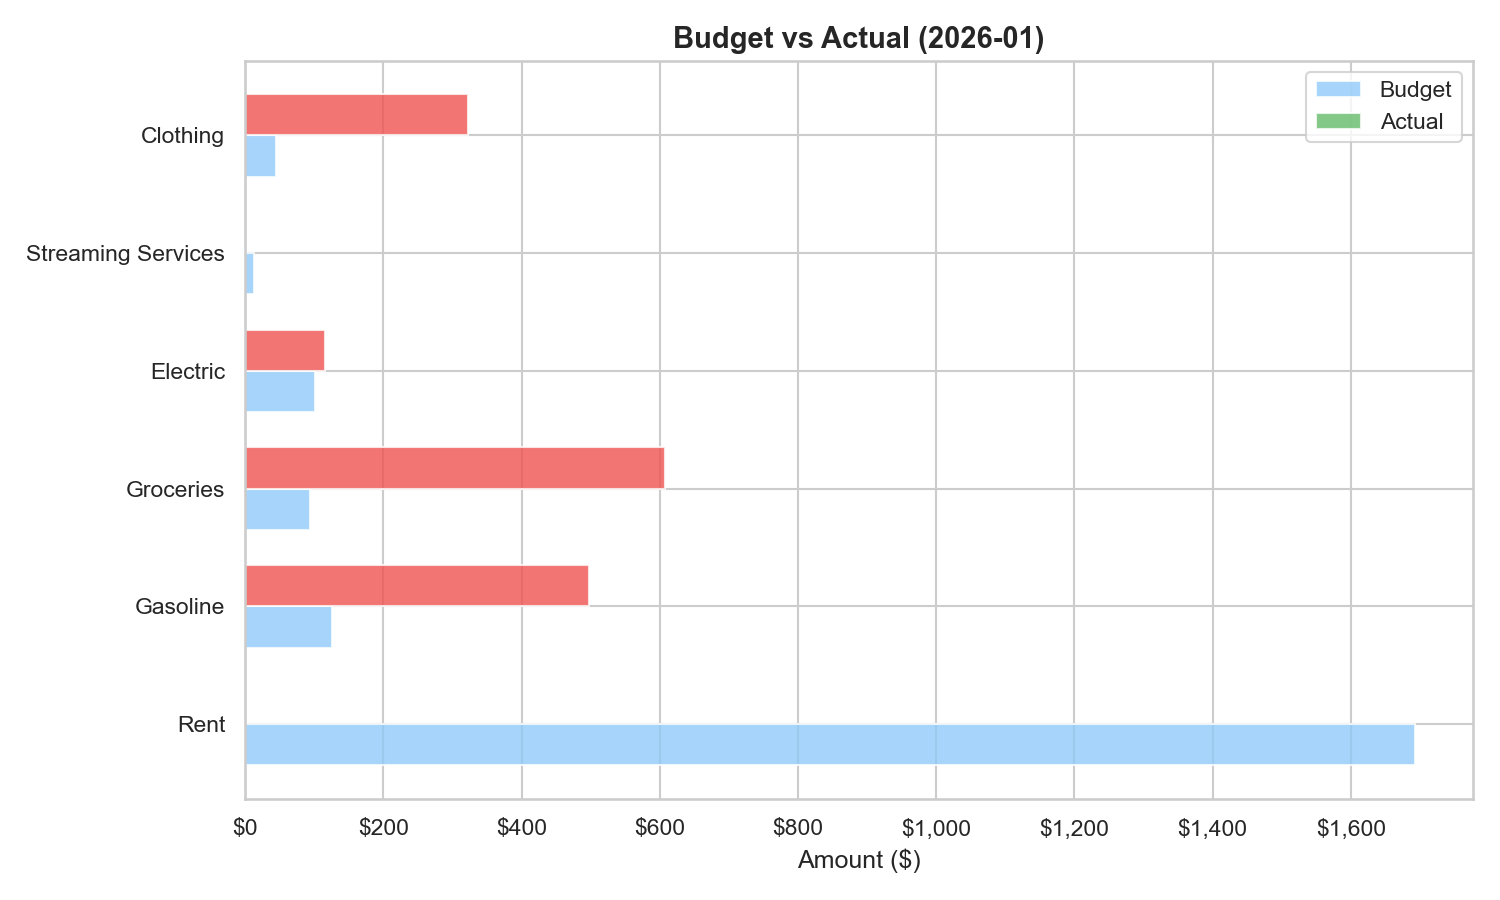
Budget Variance Dashboard — Monthly actuals vs. budgeted by category
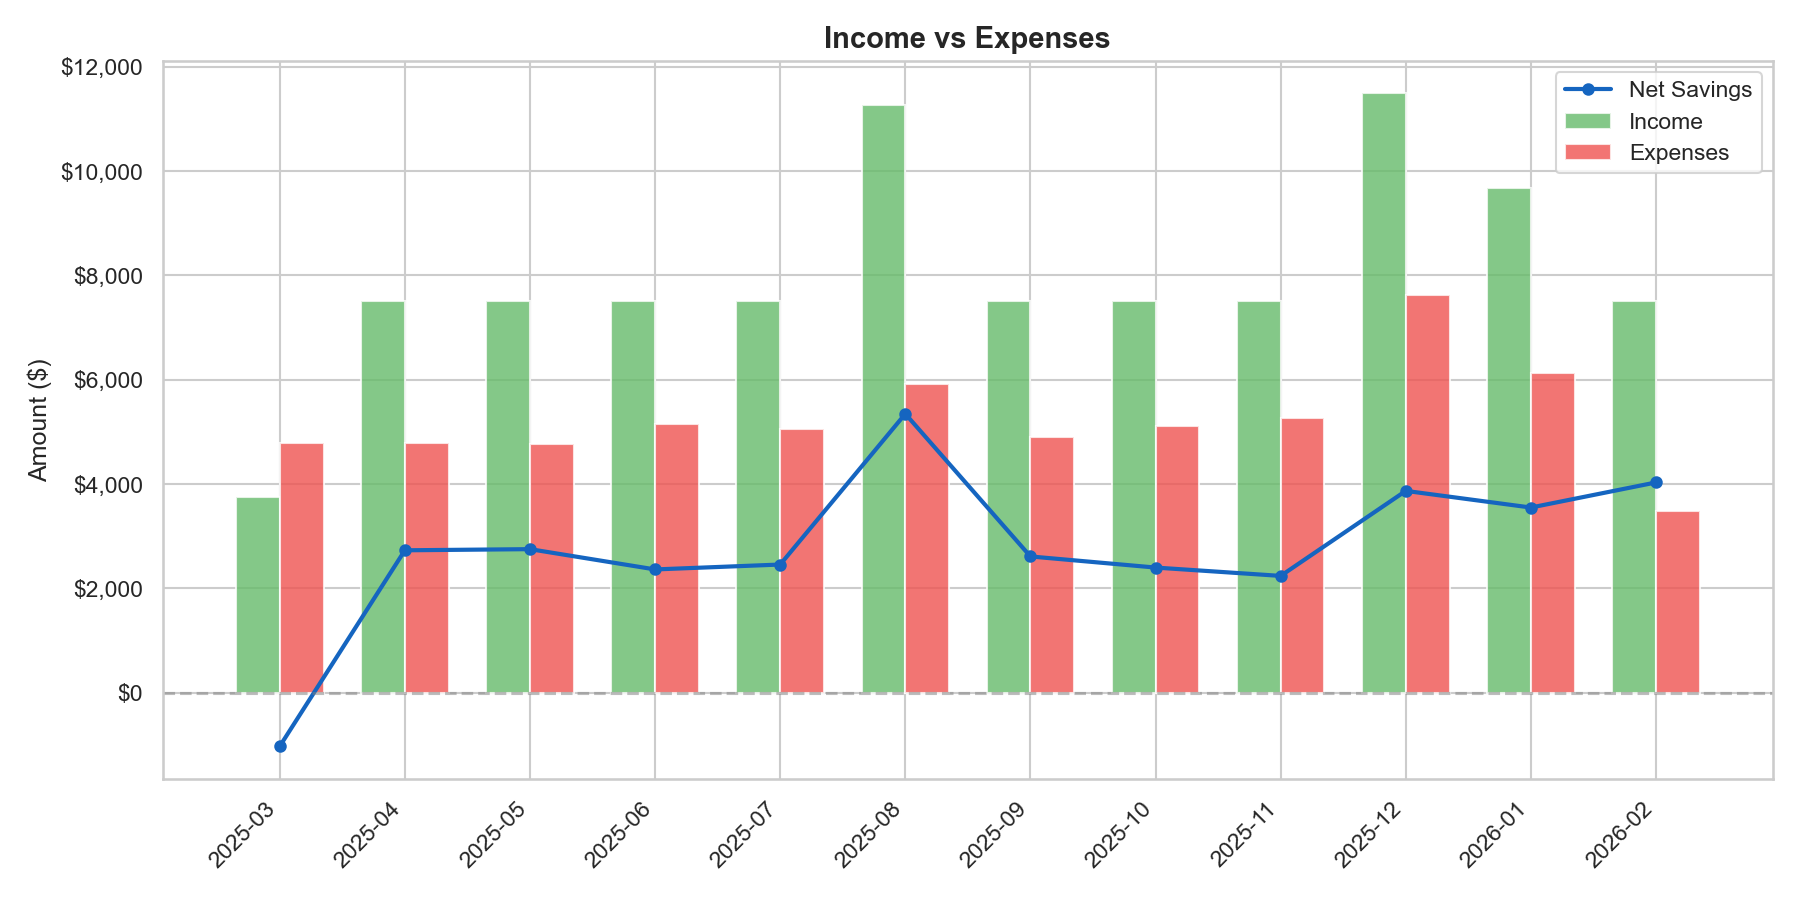
Income vs. Expenses — Monthly income and expense comparison
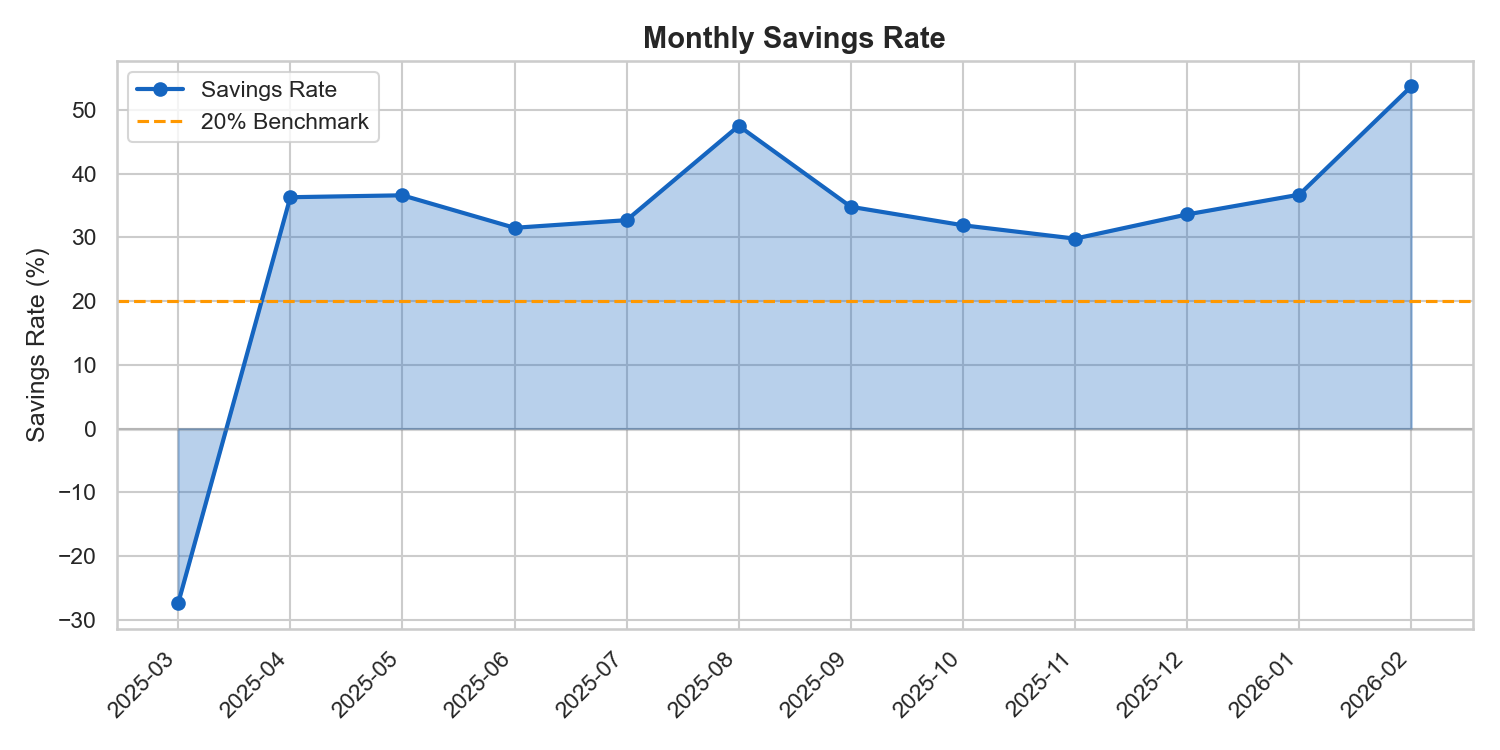
Savings Rate — Rolling savings rate over 12 months
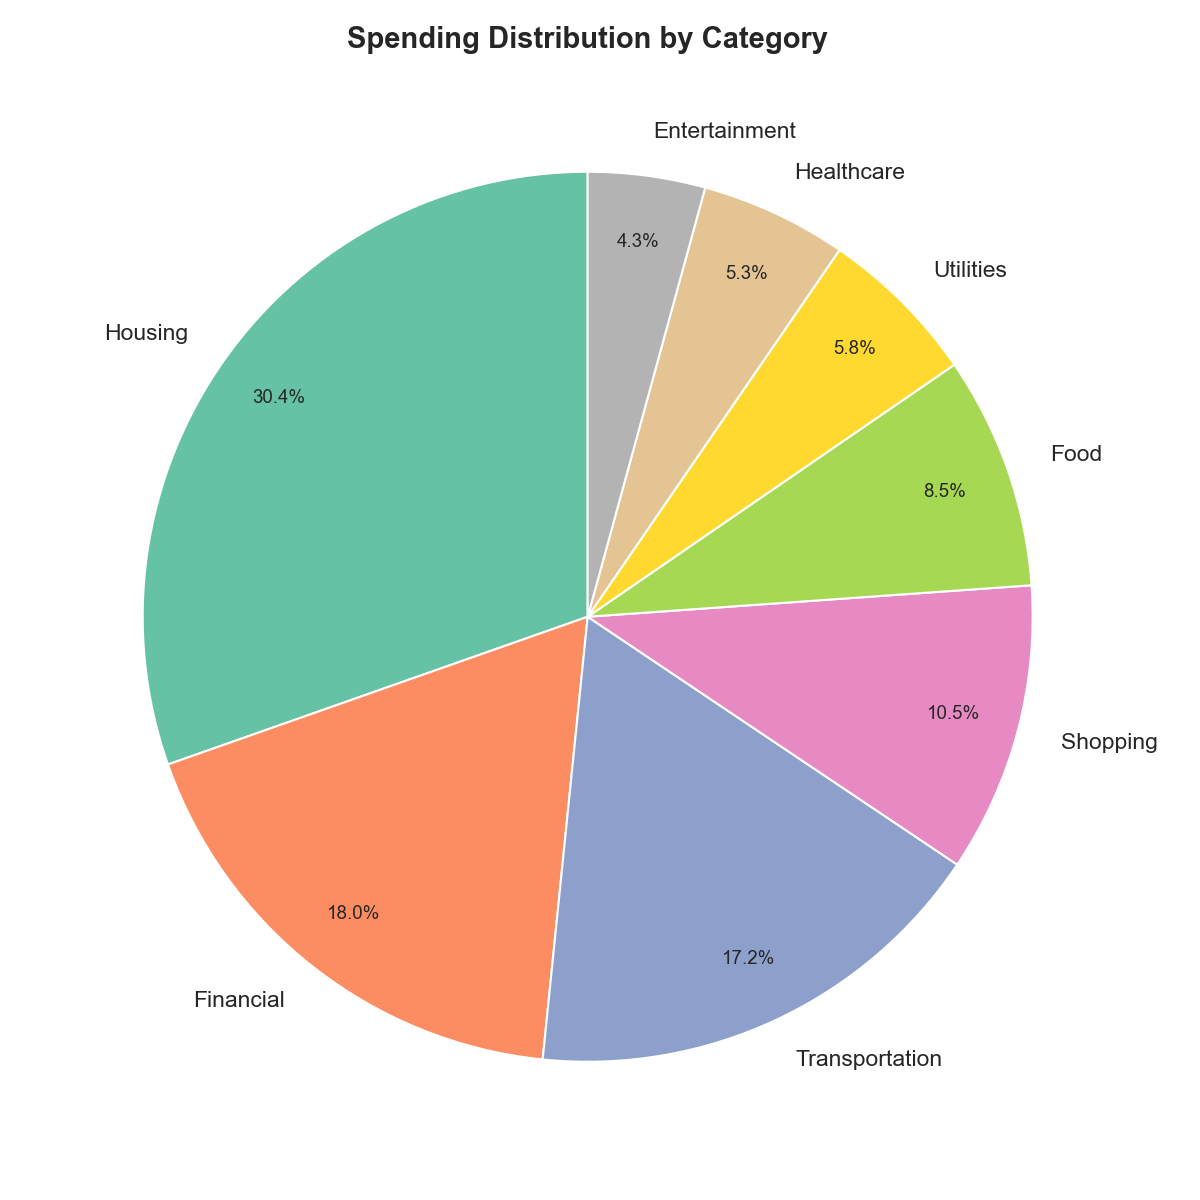
Category Breakdown — Spending distribution across categories
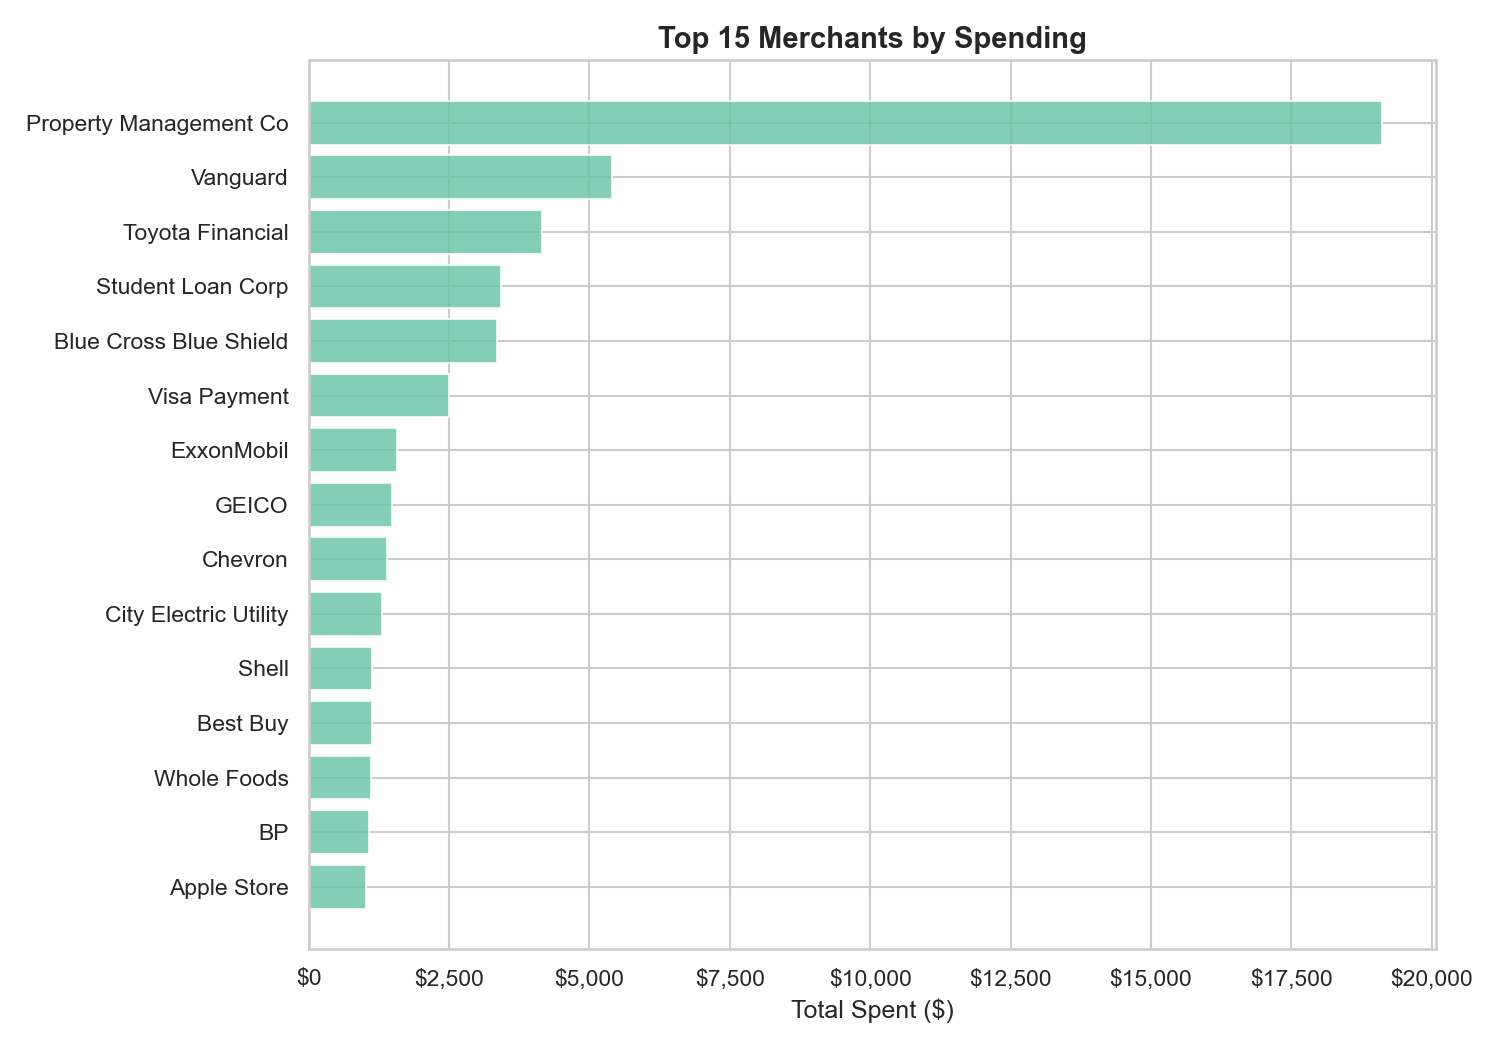
Top Merchants — Highest-spend merchants by transaction volume
Stack